
MYTH: Young people in Japan are much more willing to switch jobs compared to before
There’s a common opinion in Japan – both among foreigners and among the Japanese – that life-long employment is on its way out of the door. And part of this is the idea that young people are both far more willing to and actually do quit in larger numbers than previous generations.
At first glance, and actually just simply based on my anecdotal evidence, yep sounds right. So many of the people who graduated with me in university quit in the first three years as what they wanted from their first jobs did not align with their environments when they started work.
But anecdotes are anecdotes, I wanted to look at the data. But since this was so obvious intuitively to me, well finding data which proved this would be easy right?
Actually no, the more I dug the more the data proved otherwise. Japanese young people are not quitting significantly more than those in previous generation. Maybe the fact that many of the people around me think so is a sign of the segments of society than we belong to than how society as a whole functions in itself.
But that’s spoiling the rest of article – let’s take a look firstly at what the data says.
No real evidence for increased quitting
Thankfully, the Japanese government does have rather clear data on this topic.
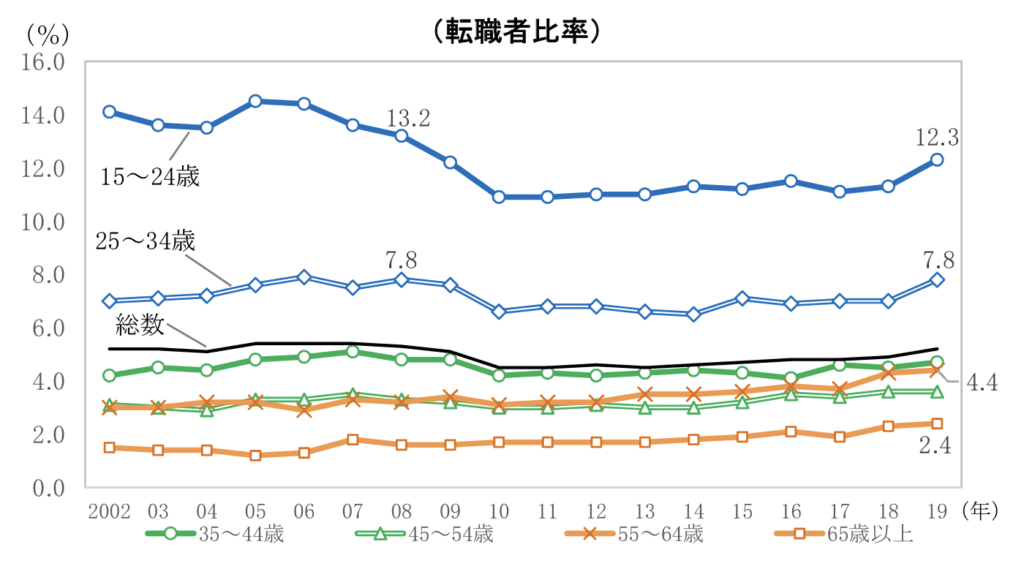
Data and graph from the Ministry of Internal Affairs and Communciations – % of all workers who switched jobs in the year, divided by age.
A you can see above, Japan’s overall percentage of people switching jobs in a year (black line) has been quite stable. Even for the youngest two segments of the population (the top two blue lines), while we see an overall increase from 2010 to 2019, even then the numbers have not crossed the highs of the mid 2000s.
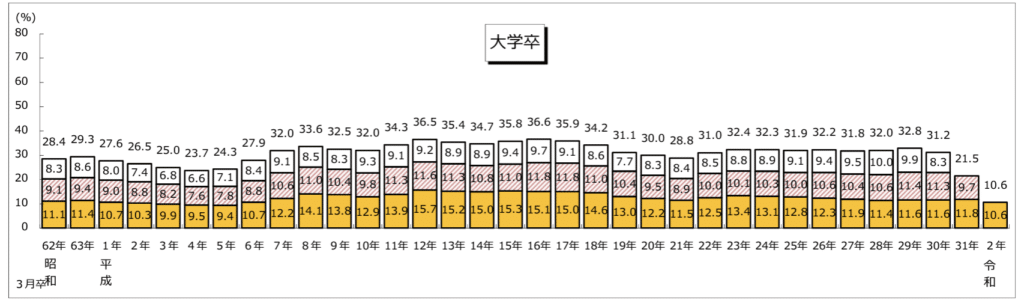
Data and graph from the Ministry of Health, Labor and Welfare – % of university graduates who quit their first job, 1987-2000.
To focus on the white-collar segment, I’m throwing out the above are statistics showing the percentage of unversity graduates who quit their first job within the first 3 years, divided by the year which they graduated and each bar divided by how many years they worked before they quit. Once again here you see that actually job-quitting rates in the past few years have not been as high as the 2000s (Heisei 12 – 18).
Do note as well both graphs show a clear slump in job-switching in 2008-2010, the reason being the global financial crisis. In times of economic downturns, people tend to want to hold on to their jobs rather than aiming to upgrade their job conditions. Despite the economic downturn from COVID being relatively light in terms of its effects on early-career recruitment, in the past two years we’re actually likely to have seen a decrease in the number of people switching jobs.
Conservatism from the lost decades

But actually, the numbers shouldn’t be that surprising if we take them as a sign of Japan’s lost decades of a stagnant economy.
Consider the following tables, from the Japan Institute for Labor Policy and Training’s surveys on what the Japanese public thinks about various career styles.
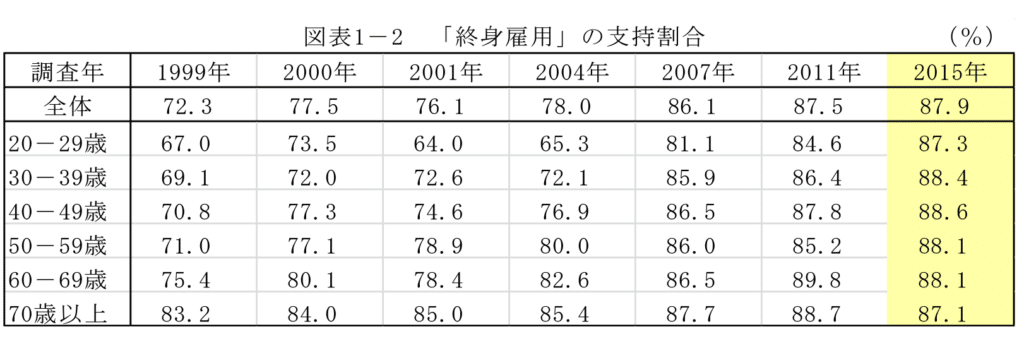
% of respondents who responded that they “support the life-long employment system”, divided by age group (top row average) and by year where survey was conducted.
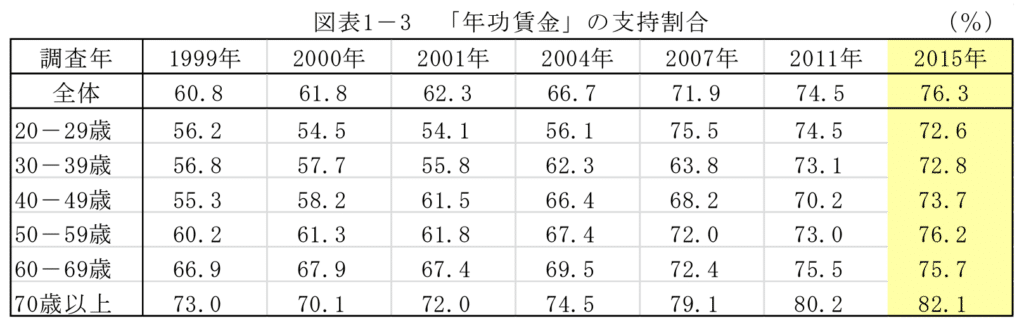
% of respondents who responded that they “support the system where wages automatically rise with age”, divided by age group (top row average) and by year where survey was conducted.
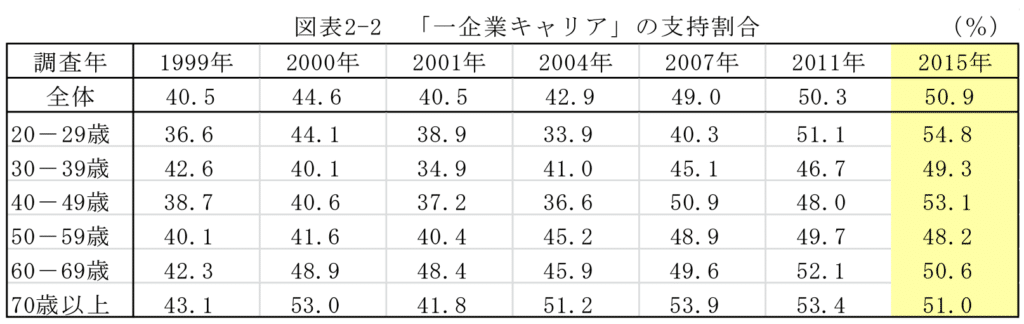
% of respondents who responded that they “support only working in a single company for their career”, divided by age group (top row average) and by year where survey was conducted.
As you can see, the attitudes of the whole Japanese public have become very conservative if you compare 2015 to 1999. In fact, throughout the period of this survey, 2015 reported the highest numbers of respondents supporting lifelong employment, single-company careers and seniority based pay among all the years where this survey was done. And very tellingly, the young (20-29) show attitudes which aren’t actually that different from those from those 70 years old and above.
When security gets scarce…

Note that by the time of 2015, most 20-29 year olds here grew up in a Japan after the bursting of the bubble economy and have only known the stagnant economic growth that Japan has experienced since thereafter.
Consider also that these thirty years have also been where the percentage of workers in the economy not under full-time termless contracts has jumped from 17% in 1989 to around 38% nowadays. Part of this is increasing participation in Japanese economy from married women re-joining the workforce in part-time work to supplement their household income – possibly a sign on how a single-income may no longer be enough to provide for a family. The other part is from people who would be given full employment being shifted to part-time or term-limited contracts.
Growing up in this environment, and as part of the much aligned Yutori generation, has meant a generally negative outlook on life prospects. This can be seen from another survey targeted at youths from ages 13 to 29. Among 7 countries surveyed, Japan has the lowest proportion of respondents being satisfied with themselves, the lowest confidence at challenging something they haven’t done before, the lowest sense of hope towards the future and the lowest percentage of respondents expecting that they will be happy at the age of 40.
Now, when we consider the psychology of this, when you aren’t really hopeful about the future, having some basic security becomes much more important than striving for better conditions. And given that this security is now rarer than before, it becomes both more attractive at the same time.
Are our impressions wrong though…?

So that’s the clear overall situation with Japanese youth. But on the other hand, it sounds slightly off for me to entirely brush off the clear impression that we have about young talent being more mobile.
This is why I tried digging more – maybe there’s polarization? Ie. the majority is getting more conservative but a key minority is moving towards a more dynamic way of doing work? There is data to show that the motivations for switching jobs are different between age groups but this alone makes it hard to differentiate real generational change (“they think this way because attitudes have changed”) versus cohort changes (“they think this way because of their current stage of life”).
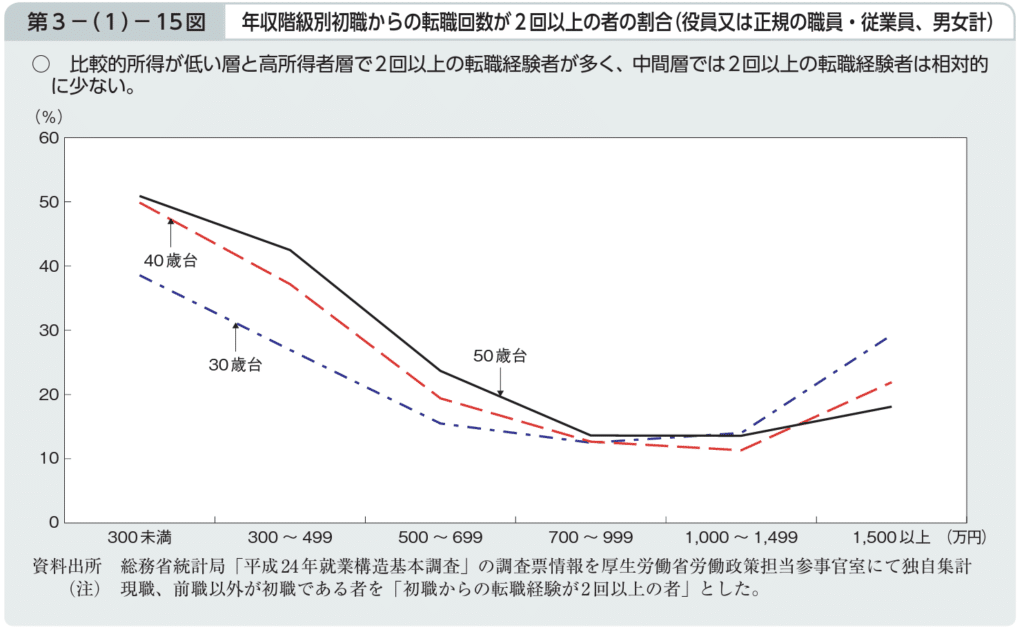
% of respondents who have switched jobs 2 of more times, divided by age group (different lines) and by income level.
There’s only one piece of data which I found does suggest something though. Another report from the Ministry of Health, Labor and Welfare does state here clearly that at least as of 2012, for people in their 30s there was a clear polarization in terms of the number of times someone switched jobs and their income. The group in the middle (around ¥6M yen) had the lowest proportion of people who switched jobs more than 2 times or had a job switch in the last 5 years, whereas the people on both extremes had far more job-switching experience.
What’s interesting is that below the ¥7M / annum line, the percentage of people in their 30s with 2 or more job changes is lower than that of the group in their 40s and 50s. Natural, given that those older also have had more time to “reach” 2 or more job changes. Beyond ¥7M / annum though, the proportion almost equal to or is higher than those in their 40s and 50s. This does in turn suggest that young, higher income talent are switching jobs earlier and more frequently than their seniors.
I could not find more recent data for this but my sense is that this can probably be extended to today and to the job dynamics of the people in their 20s. If you want to find out why this is not shown at all in the previous statistics though, you need to see how rare and fortunate this segment of society is. As of 2014, salaried workers who earned above ¥7M only accounted for 0.6% of men and 0.2% of women between 30-34 and 1.2% for men and 0.5% of women (download relevant data here).
But isn’t this the segment that most of you reading this are looking at?

On the other hand though, it is my guess that this is exactly the segment that you (and me) are probably looking at in Japan. Either you are a Japanese person who reads English fluently (in which case you are in the highly in-demand and highly-paid bilingual sector) or you are a foreigner who is probably interested in or who is already living in Japan. If you are the latter too (and reading this blog), you are also probably a white-collar person who is either also bilingual or has an advanced degree with other skills. The very fact that you are likely to be a bilingual also means that there is a high chance that you work in a Gaishikei. In all likelihood you’re probably in Tokyo, or possibly Osaka if not one of the other big cities of Japan.
The thing that I want to convey here is that our impressions are probably not wrong. It’s just that they’re probably limited to maybe the highly-skilled, often bilingual, white collar, big-city, top 3% segment of Japanese society. This is the segment where there is more demand and supply and more bargaining power which incentivizes people to switch jobs.
But as a whole though, in Japanese society, young people being very willing to switch jobs is a myth. Security is simply too much at a premium for people to switch jobs that easily. This is why I think that we need to have a more complete overview when we talk about Japan and not take our reality to be the reality of society overall.